MongoDB provides various metrics through their serverStatus command call. Setting up monitoring for MongoDB with Nixstats is easy, you can read more at our helpdesk.
Important MongoDB Metrics
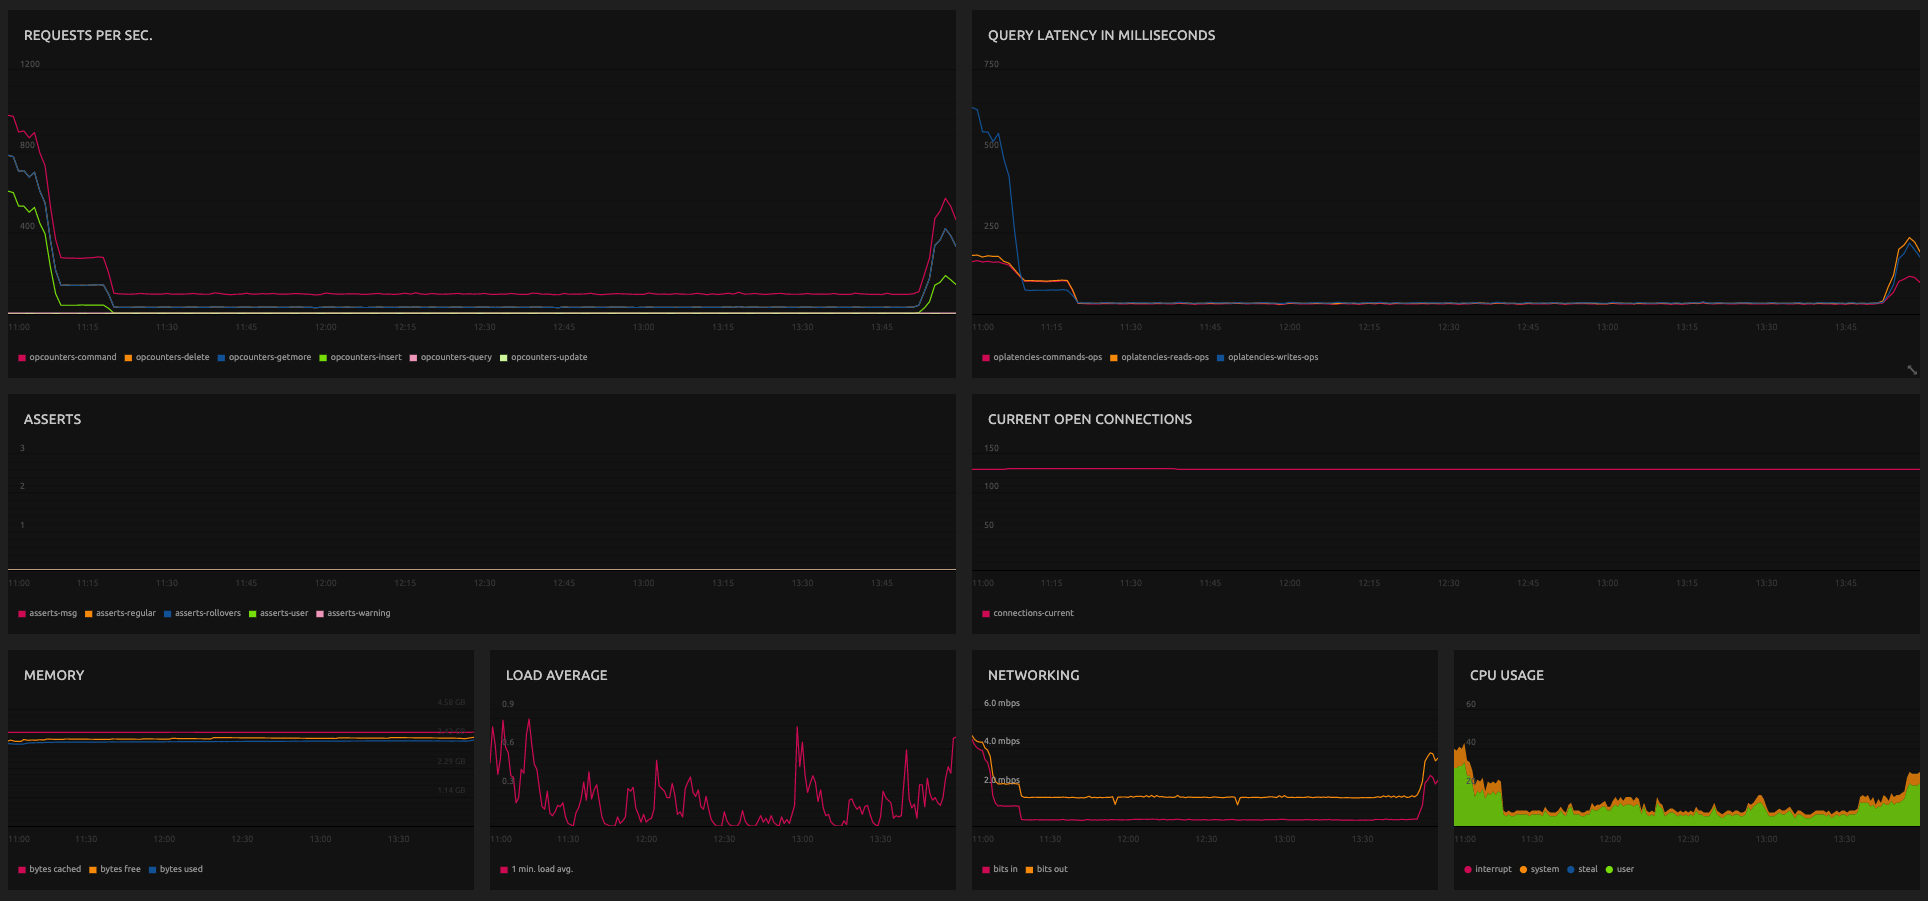
The most important metrics to watch and alert to for MongoDB are asserts which represent errors. More
details about asserts can be found in the mongodb log files, we recommend setting up logging to Nixstats for easy
management. You can setup a daily log alert to notify you of any assert errors in your logs.
MongoDB Metrics
The following metrics are available from the MongoDB monitoring plugin. Source code is available on GitHub.
-
asserts-msg
Indicate internal server exceptions. Check the log file for more information about these messages.
-
asserts-regular
Per operation invariants (for example “unexpected failure while reading a BSON document”). Check the log file for more information about these messages.
-
asserts-rollovers
The number of times that the rollover counters have rolled over since the last time the MongoDB process started.
-
asserts-user
Indicates error returned to the client such as a duplicate key exception or write error.
-
asserts-warning
Indicates less serious errors such as a low ulimit. Check the log file for more information about these messages.
-
connections-available
The number of unused incoming connections available.
-
connections-current
The number of incoming connections from clients to the database server .
-
connections-totalCreated
Count of all incoming connections created to the server. This number includes connections that have since closed.
-
globalLock-activeClients-readers
The number of the active client connections performing read operations.
-
globalLock-activeClients-total
The total number of internal client connections to the database including system threads as well as queued readers and writers.
-
globalLock-activeClients-writers
The number of active client connections performing write operations.
-
globalLock-currentQueue-total
The total number of operations queued waiting for the lock.
-
globalLock-currentQueue-writers
The number of operations that are currently queued and waiting for the write lock. A consistently small write-queue, particularly of shorter operations, is no cause for concern.
-
globalLock-currentQueue-readers
The number of operations that are currently queued and waiting for the read lock. A consistently small read-queue, particularly of shorter operations, should cause no concern.
-
isprimary
1 for primary replicaset status, 0 for secondary.
-
locks-collection-acquireCount-r
-
locks-collection-acquireCount-w
-
locks-database-acquireCount-R
-
locks-database-acquireCount-W
-
locks-database-acquireCount-r
-
locks-database-acquireCount-w
-
locks-database-acquireWaitCount-W
-
locks-database-acquireWaitCount-r
-
locks-database-acquireWaitCount-w
-
locks-database-timeAcquiringMicros-W
-
locks-database-timeAcquiringMicros-r
-
locks-database-timeAcquiringMicros-w
-
locks-global-acquireCount-W
-
locks-global-acquireCount-r
-
locks-global-acquireCount-w
-
locks-global-acquireWaitCount-W
-
locks-global-acquireWaitCount-r
-
locks-global-acquireWaitCount-w
-
locks-global-timeAcquiringMicros-W
-
locks-global-timeAcquiringMicros-r
-
locks-global-timeAcquiringMicros-w
-
locks-metadata-acquireCount-W
-
locks-oplog-acquireCount-W
-
locks-oplog-acquireCount-r
-
locks-oplog-acquireCount-w
-
mem-bits
Indicates a 64bit or 32bit instance of mongod
-
mem-resident
The value of mem.resident is roughly equivalent to the amount of RAM, in mebibyte (MiB), currently used by the database process.
-
mem-supported
-
mem-virtual
Displays the quantity, in mebibyte (MiB), of virtual memory used by the mongod process.
-
members
The amount of members in a replicaset.
-
opLatencies-commands-latency
Query latency for command queries in microseconds.
-
opLatencies-commands-ops
The number of operations performed on the collection.
-
opLatencies-reads-latency
Query latency for read queries in microseconds.
-
opLatencies-reads-ops
The number of operations performed on the collection.
-
opLatencies-writes-latency
Query latency for write queries in microseconds.
-
opLatencies-writes-ops
The number of operations performed on the collection.
-
opcounters-command
The amount of command operations per second.
-
opcounters-delete
The amount of delete operations per second.
-
opcounters-getmore
The amount of getmore operations per second.
-
opcounters-insert
The amount of insert operations per second.
-
opcounters-query
The amount of query operations per second.
-
opcounters-update
The amount of update operations per second.
-
opcountersRepl-command
The number of replicated command operations per second.
-
opcountersRepl-delete
The number of replicated delete operations per second.
-
opcountersRepl-getmore
The number of replicated getmore operations per second.
-
opcountersRepl-insert
The number of replicated insert operations per second.
-
opcountersRepl-query
The number of replicated query operations per second.
-
opcountersRepl-update
The number of replicated update operations per second.
-
transactions-retriedCommandsCount
The total number of retry attempts that have been received after the corresponding retryable write command has already been committed
-
transactions-retriedStatementsCount
The total number of write statements associated with the retried commands in transactions.retriedCommandsCount.
-
transactions-transactionsCollectionWriteCount
The number of writes to the config.transactions collection, triggered when a new retryable write statement is committed.