PHP-FPM provides various metrics thru their status page. Setting up monitoring for PHP-FPM with Nixstats is easy, you can read more at our helpdesk.
PHP-FPM Metrics
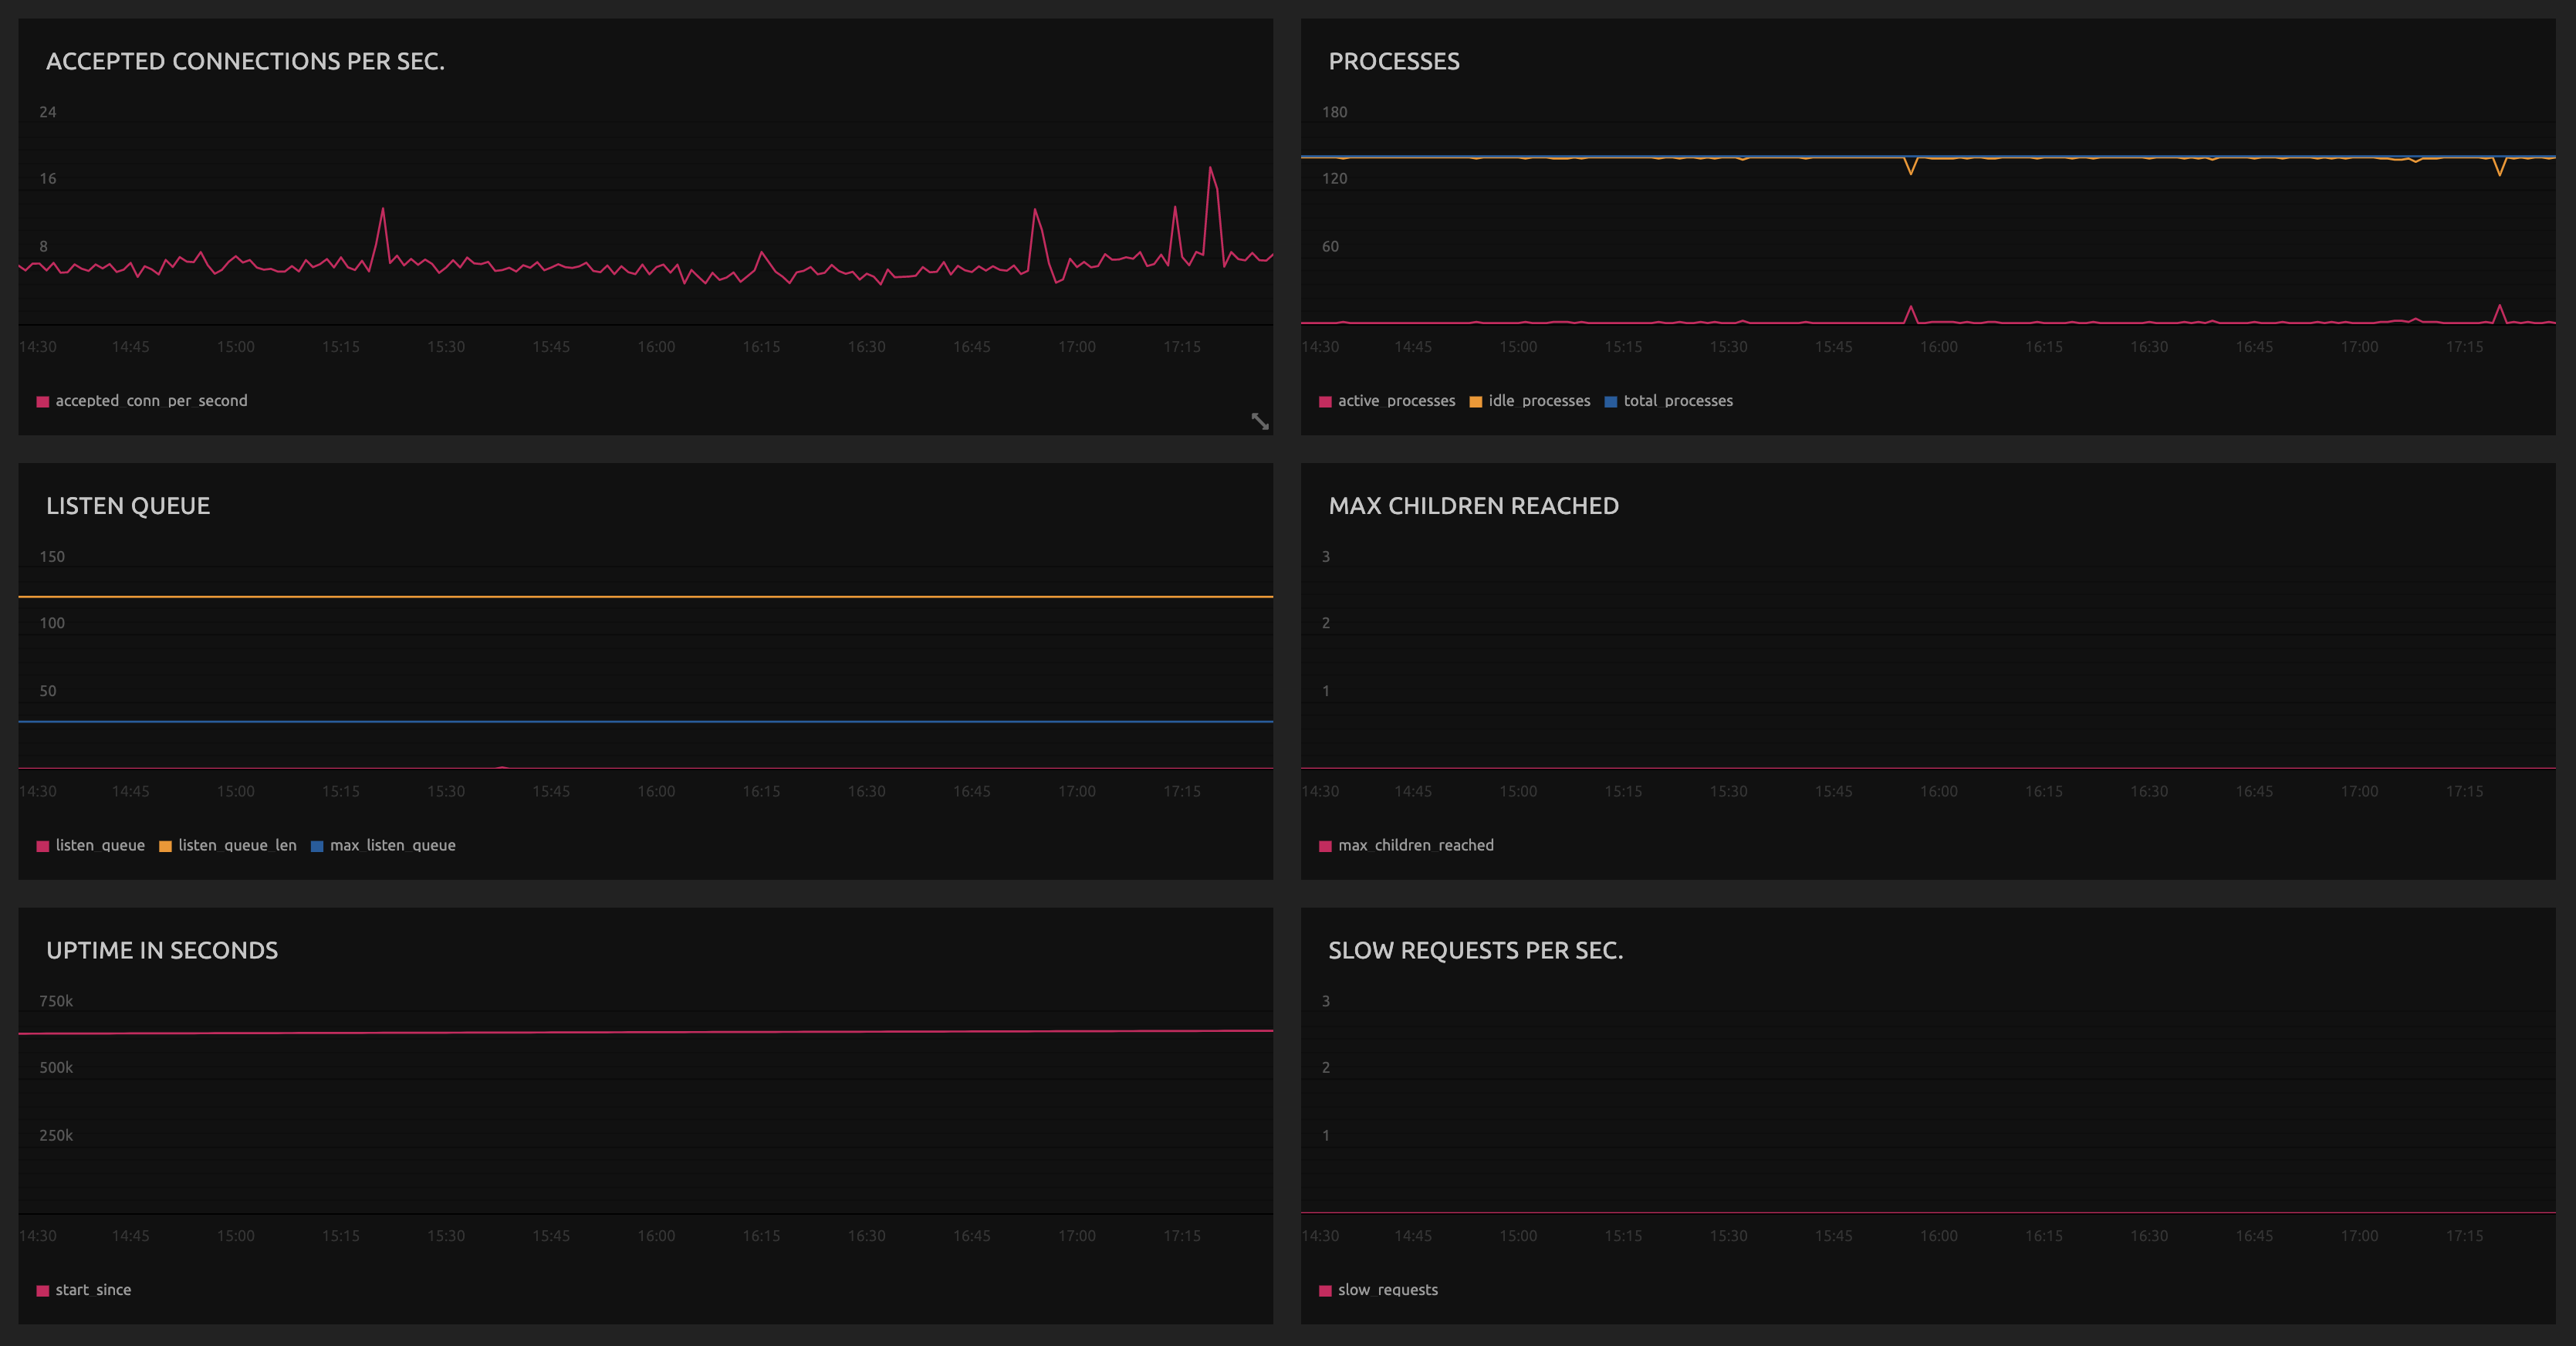
The following metrics are available from the PHP-FPM monitoring plugin. Source code is available on GitHub.
- accepted_conn
The total amount of accepted client connections per second.
- accepted_conn_per_second
The amount of client connections/requests per second.
- active_processes
Currently running active processes.
- idle_processes
Currently processes in idle state.
- listen_queue
The number of connections that have been initiated but not yet accepted.
- listen_queue_len
The maximum number of connections that will be queued. Once this limit is reached, subsequent connections will be refused or ignored. As connections are accepted, the queue length will be reduced.
- max_active_processes
The maximum amount of active processes since the start of php-fpm.
- max_children_reached
The maximum amount of children reached since the start of php-fpm.
- max_listen_queue
The maximum value the listen queue has reached since the start of php-fpm.
- pool
Name of the php-fpm pool.
- slow_requests
Amount of requests that exceeded your
request_slowlog_timeoutvalue. - start_since
Seconds that php-fpm has been running.
- start_time
Unix timestamp of start date.
- total_processes
Number of idle plus active processes.